The wave model was driven by hourly wind data generated by the regional atmospheric
model REMO at the 0.5 deg horizontal resolution (Jacob and Podzun, 1997). The spatial
and temporal resolution of the wind data used for wave model forcing was sufficient to
resolve the critical coastal areas. The WAM model was run over the Mediterranean with
the grid resolution of 0.50 deg and with two grids used in a 2-way nesting mode: one
over the Eastern Mediterranean with 0.25 deg resolution and another over the Central
Mediterranean with 0.125 deg resolution.
The comprehensive and consistent data set of hourly values of wave and wind parameters
produced by the model is used for an analysis of spatial and temporal variability in
the region of interest. The main advantage of the hindcasts is their high spatial and
temporal resolution, that makes them the most suitable source for the climatology
study in this area. The parameters used in analysis are: significant wave height (Hs),
mean wave direction, peak period (Tp) of total sea (includes the both wind wave and
swell components), wind speed (Ws) and wind direction.
|
|
|
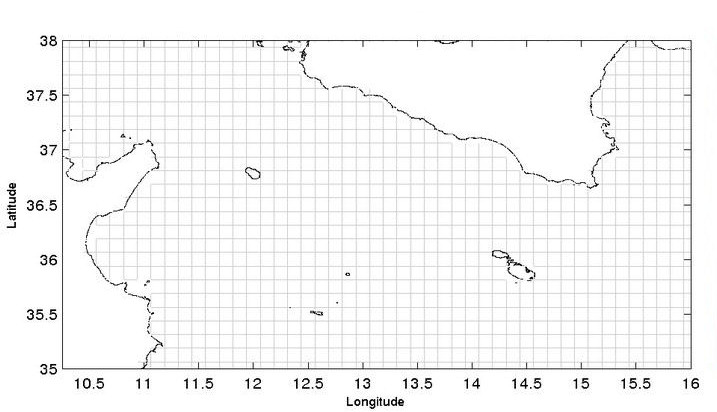
Fig. 1 Domain covered by the climatology at 1/8 degrees resolution
|
The methodology consisted in preparing monthly time series of hourly values of wind
and wave parameters at each grid point in the area of interest; statistical analysis
of these monthly time-series is done by calculating mean values, standard deviation
and minima/maxima, as well as the 99th, 90th, 75th, 50th and 25th percentiles for
wind speed, significant wave height and wave period. Seasonal variability was more
closely examined by studying the set of monthly extremes. The frequency (% occurrence)
distribution of wind direction is calculated at a selected representative subset of
points in order to identify the dominant wind conditions in the area of study.
The full climatology is compiled in the form of 2D plots, and summary tables and
charts. The results are prepared at several levels:
-
monthly and seasonal climatology maps of different parameters including mean
wind speed and direction, mean max/min wind, extreme min/max wind, percentiles
and standard deviation for mean wind speed, mean wave height and direction,
mean max/min wave, extreme min/max wave, average mean/peak wave period,
standard deviation for peak/mean;
-
wind roses and wind frequency tables at selected points, including the
approaches to the Maltese Islands;
-
statistical information averaged over ten pre-defined zones.
The climatology can be accessed through this web interface which allows viewing
at three levels:

|
Level 1
- Displaying charts of the selected parameters and statistical diagnostics on three temporal resolutions;
|
Monthly
|
January - December
|
|
Seasonal
|
Winter = Dec - Feb;Spring = Mar - May; Summer = Jun - Aug Autumn = Sep - Nov
|
|
Annual
|
Averaging fields over the full year.
|
|
|
|
Level 2
- Allowing the user to select one of a number of pre-selected areas and displaying
a set of statistics and a series of plots showing the monthly wave statistics for
the selected area.
|
|
|
Level 3
- Allowing the user to choose a point, a customised area or transect from the map and
request the viewing or downloading of data with full flexibility.
|