A system for operational numerical weather prediction has been setup and implemented at the Physical Oceanography Unit, IOI-Malta Operational Center within the University of Malta. The system has been implemented as part of the WERMED activities with the support of Svetlana Music. It is based on the atmospheric limited area NCEP/Eta model (Janjic, 1984, Mesinger et al, 1988). Its main runtime components are the: |

|
- data acquisition and pre-processing for preparation of boundary conditions and input fields
- model run at the computing centre of the PO-Unit
- post-processing and graphical presentation of model output
- scripts and procedures for automatic daily operation
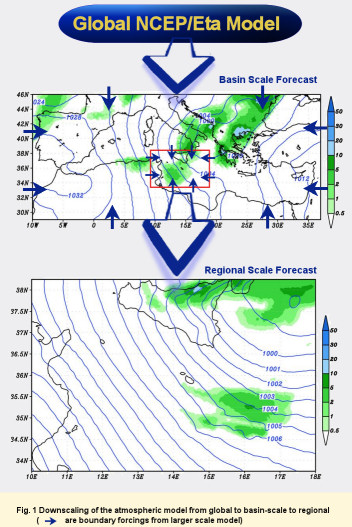
The downscaling of atmospheric conditions to the subregional scale is done by executing the model runs in two successive steps with nested successively embedded model configurations as shown in Fig. 1. The first run is performed with the coarser resolution basin scale NCEP/Eta model (~32 km) over the whole Mediterranean region. This in turn provides detailed initial and boundary conditions to the second model with the higher resolution over the Central Mediterranean area. In the vertical, the basin scale model uses 32 levels from the ground up to 16 km. For the initial and boundary conditions the NCEP objective analysis gridded data are used, on a 1.25 deg horizontal grid increment, for 10 standard pressure levels(from 1000-100hPa). The basin scale forecast is run on a daily basis, starting from 12h GMT of the current day and produces a 72-hour forecast with 6-hour outputs. The second run is the high-resolution model (~5km) over the Central Mediterranean It also runs daily starting from 12hr GMT of the current daily and producing a 48-hour forecast with 3-hour outputs. The first model level is at 20m above the sea level. Prognostic variables are temperature (T), wind (u,v components), specific humidity (q), surface pressure (ps) and turbulent kinetic energy (TKE). The output parameters are: Geopotential, Temperature, Specific Humidity, wind components on 10 vertical standard pressure levels and surface parameter such as: 2m Temperature, 10m wind, 2m relative humidity, surface fluxes (latent, heat and radiative).
Data Acquisition and Pre-processing
The input data for the forecasting system are:
- initial and boundary conditions
- topography data
- vegetation and soil data
- sea surface temperature (SST)
NCEP octant data are used for initial and boundary conditions for the Eta model. The NCEP data are in GRIB form, with horizontal resolution of 1.25 deg and vertical resolution of 12 pressure levels from 1000-70 hPa. The parameters used are: geopotential, wind components and specific humidity. The US Geological Survey topographic data set with 30x30 arc sec horizontal resolution is used for creating the Eta model orography data. For vegetation, the 10x10 min gridded data are used while for soil textural class the UN/FAO data set is used after its conversion from soil type to soil textural classes.The NCEP data in GRIB form, with horizontal resolution of 0.5 degree, are used to prapare the SST input data set into the Eta model.Topography, vegetation and soil data are the so called "permanent" input data, that is why they are created once for the selected area of integrations. Initial and boundary conditions data and SST data are collected daily from the tgftp.nws.noaa.gov site.
The initial and boundary conditions data are decoded from GRIB format and interpolated into the Eta model grid. In the preparation phase, surface parameters, observed or pre-defined (topography, sea surface temperature, soil and vegetation types, soil temperature, wetness and albedo) are specified in the model grid, and the model configuration constants are prepared. The area of the model integration is shown on Fig.1. |
|
Model Setup
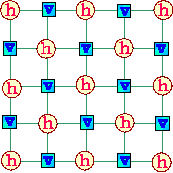
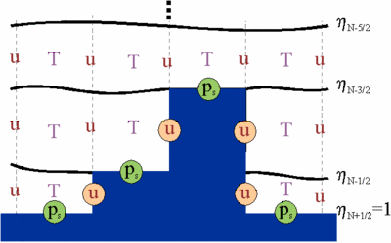
The Eta model is a hydrostatic limited area grid point model with a "step-mountain" vertical coordinate. In the horizontal, the Eta model is defined over the semi-staggered E grid, as shown in Fig. 2 . The mountains in the Eta system are represented as grid-box mountain blocks, as schematically shown in Fig.3. The non-slip bottom boundary condition used at the vertical sides of the model mountains provides efficient simulation of the blocking/splitting/channeling effects due to mountain influence. The second-order nonlinear advection scheme is designed for the horizontal advection terms in model equations (Janjic, 1984). This scheme conserves several important parameters such as mass, energy and squared vorticity and prevent a false generation of the numerical noise typical for many other atmospheric models. The Eta model uses explicit time differencing schemes (Mesinger, 1973, 1977; Janjic, 1974, 1979). Lateral boundary conditions are one-way interaction defined from 6-hr tendencies from NCEP global model forecasts. Vertical turbulent mixing between levels in the free atmosphere is performed by using mixing coefficients of the Mellor-Yamada 2.5 level turbulence (Mellor and Yamada, 1974, 1982, Janjic, 1990). Vertical mixing in the surface layer is performed by a Monin-Obukhov similarity model. The Model calculates the surface parameters using a viscous sub-layer scheme (Janjic, 1994).
|
|
Figure 2. Eta model horizontal semi-staggered E grid |
Figure 3. Eta model integration area |
Different viscous sublayer approaches are applied over ground and over water surfaces in the model. Over the sea it is assumed that the viscous sublayer operates in three regimes: smooth and transitional, rough and rough with spray, depending on the Reynolds number. A Nonlinear forth-order lateral diffusion scheme with the diffusion coefficient depending on the deformation and the turbulent kinetic energy is introduced in order to control the level of small-scale noise. For the simulation of the radiative atmospheric effects, the GFDL radiation scheme is used, which includes interactive random overlap cloud effects. The revised Betts-Miller deep and shallow cumulus convection scheme is used in order to represent moisture processes responsible for excessive precipitation events (Betts, 1986; Betts and Miller, 1986, Janjic, 1994). The large-scale condensation scheme is implemented to simulate moist atmospheric processes of larger scales.
Post-processing and Graphical presentation
Model variables are interpolated from the model grid to regular lat/long grid and from the model vertical levels to the standard pressure levels from 1000-100 hPa. GrADS graphical package is used for the model output presentation.
Scripts and procedures for automatic daily operation
In order to run the forecasting system operationally, scripts are created to activate the full chain of routines. Scripts for data acquisition are executed at the pre-defined times. When all input data are collected, the procedure for the automatic run is started. It executes several routine for decoding, preprocessing, and then model execution and after that post-processing and graphical presentation of model results. When images with model forecasts are ready they are uploaded to the web site. |